Managing subscriptions
How customers view and manage subscriptions in Bunny's customer portal: changing quantities, switching plans, add-ons and viewing usage.
The customer can see all their current subscriptions in the portal. This is a page you might want to link to from your SaaS application via a Manage subscription link.
In the example below, the custome has two subscriptions: one with recurring charges and one with usage-based charges.
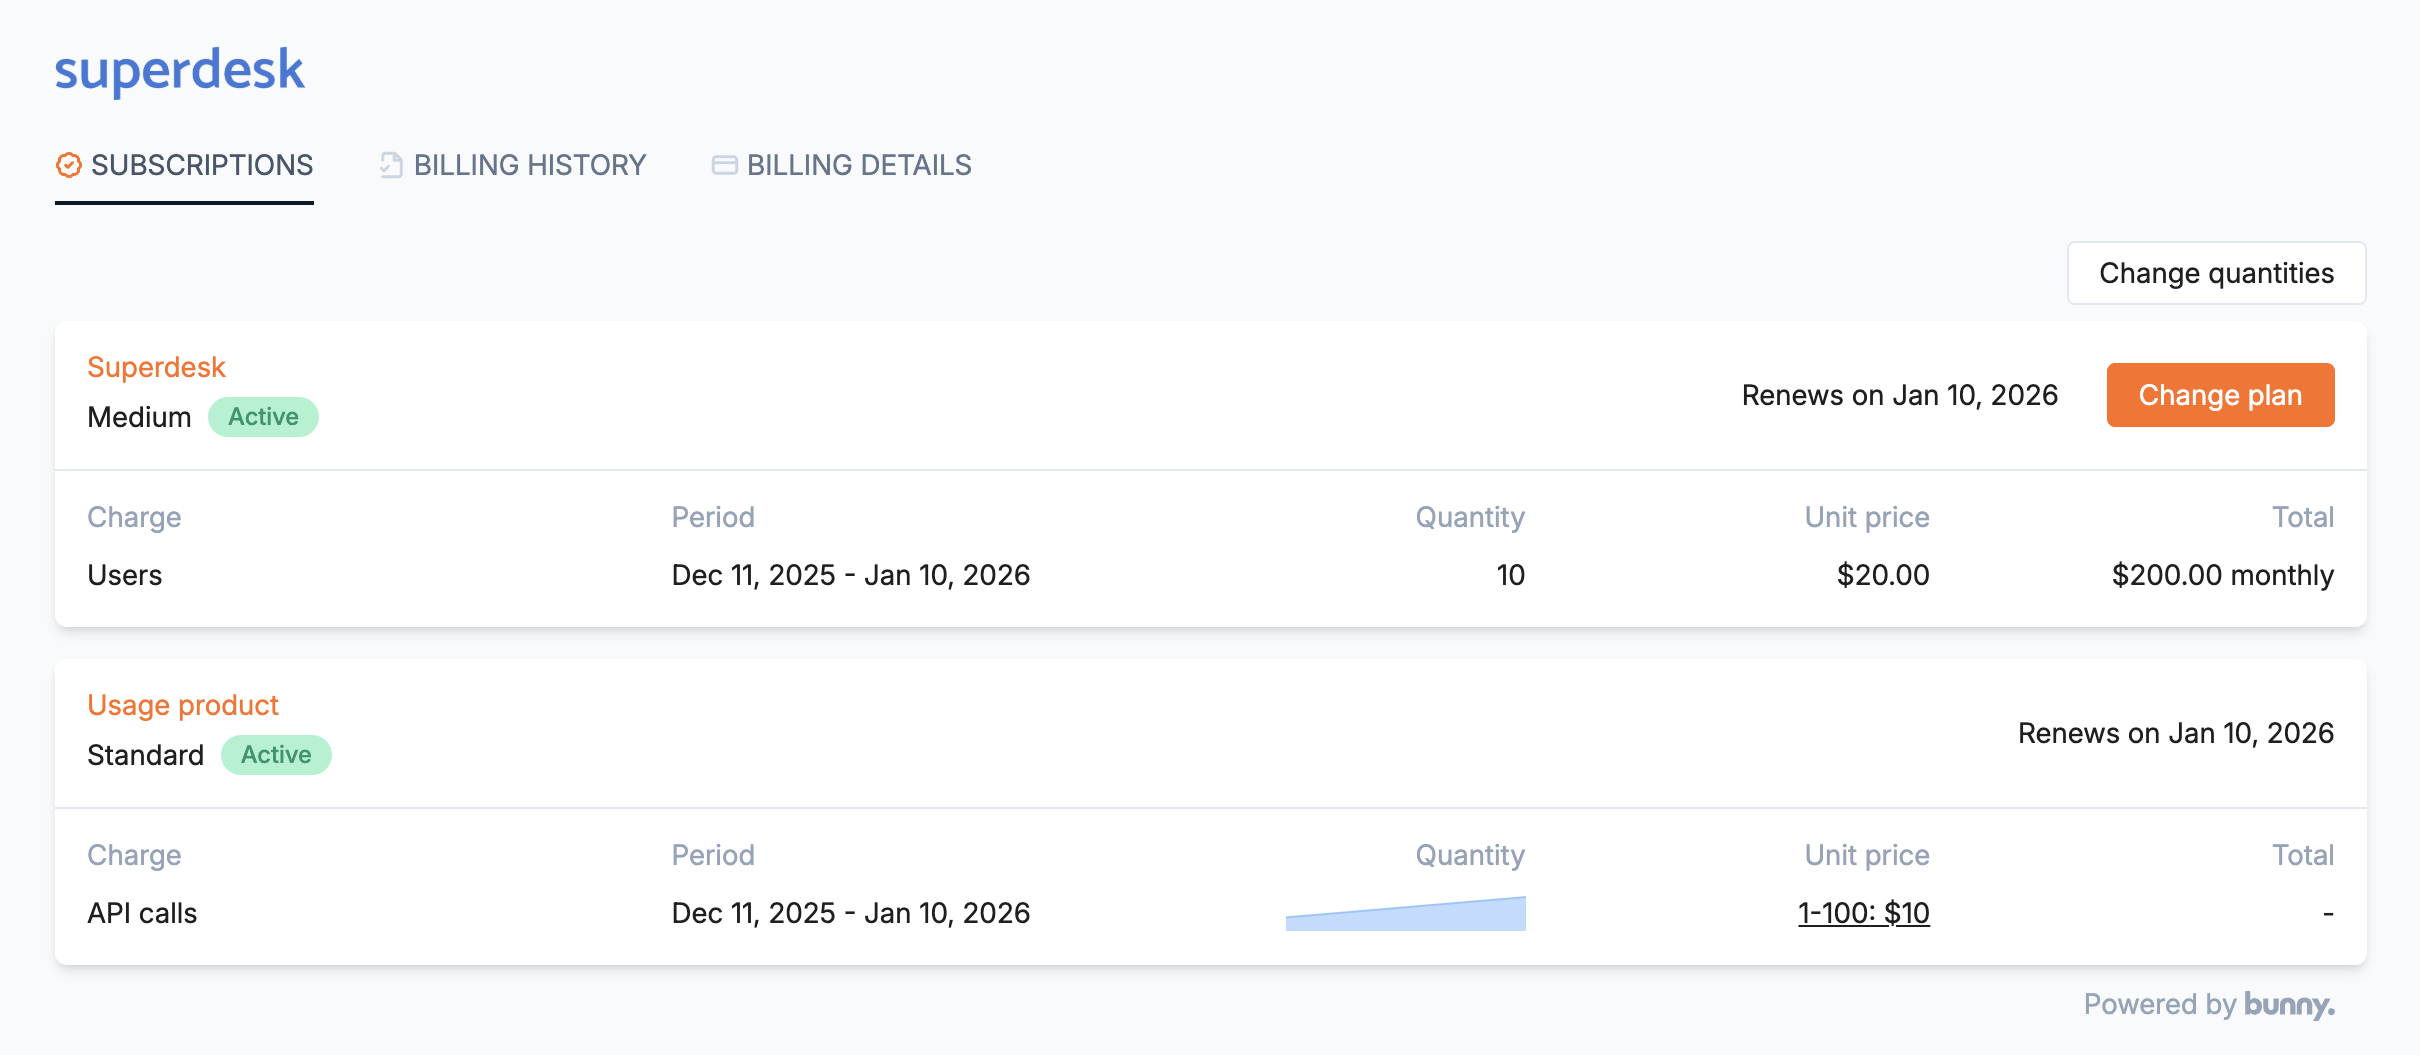
Depending on the self-service settings in the product catalog, the user will be able to change quantities, switch plans, cancel and renew subscriptions.
Changing quantities
If the product catalog allows it, the user can change quantities on a subscription. When clicking the Change quantities link at the top, all the active subscriptions’ quantities can be changed as a single transaction.
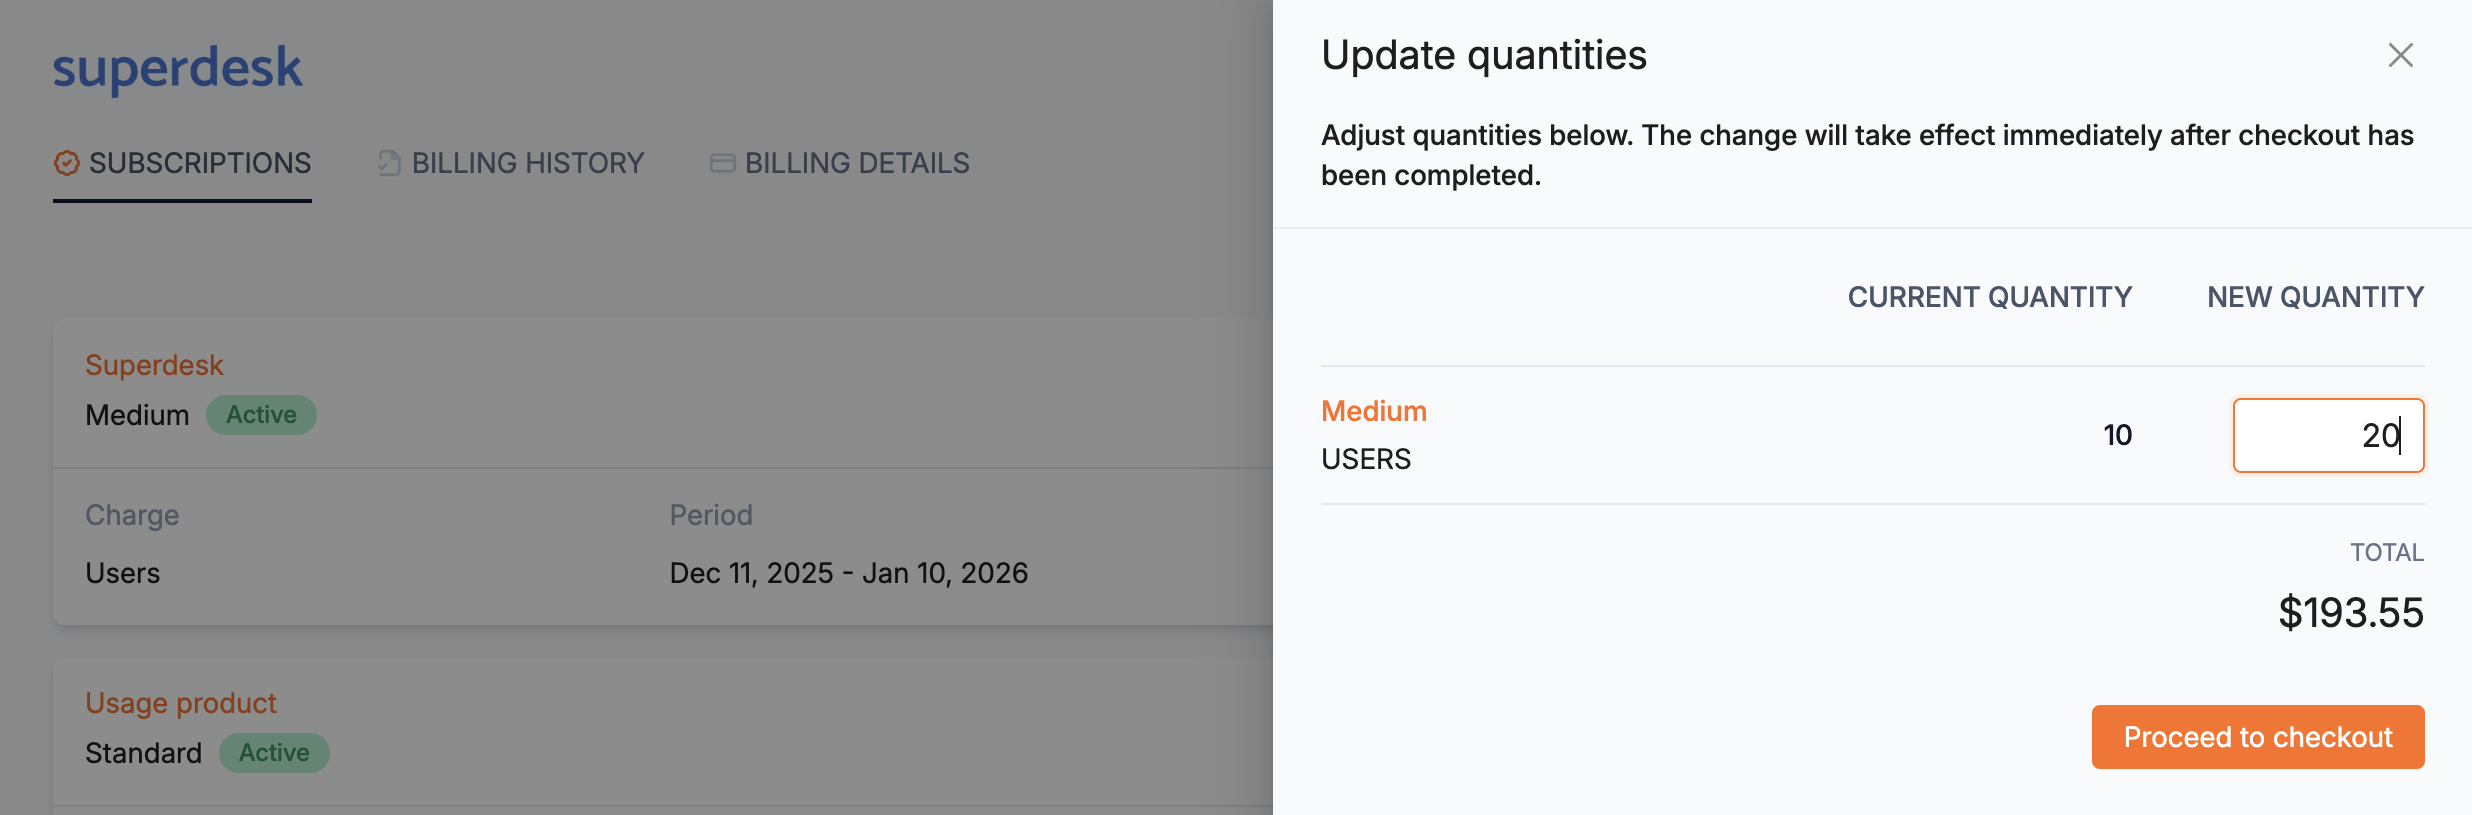
As the quantities are changed, Bunny will summarize the cost of the transaction to the far right and the user can check out and pay any time using the available payment methods.
Changing plans
If self-service has been enabled for the plans in the product catalog, customers will be able to change plans. Customers can change both plans and price list (e.g. billing period) if enabled.
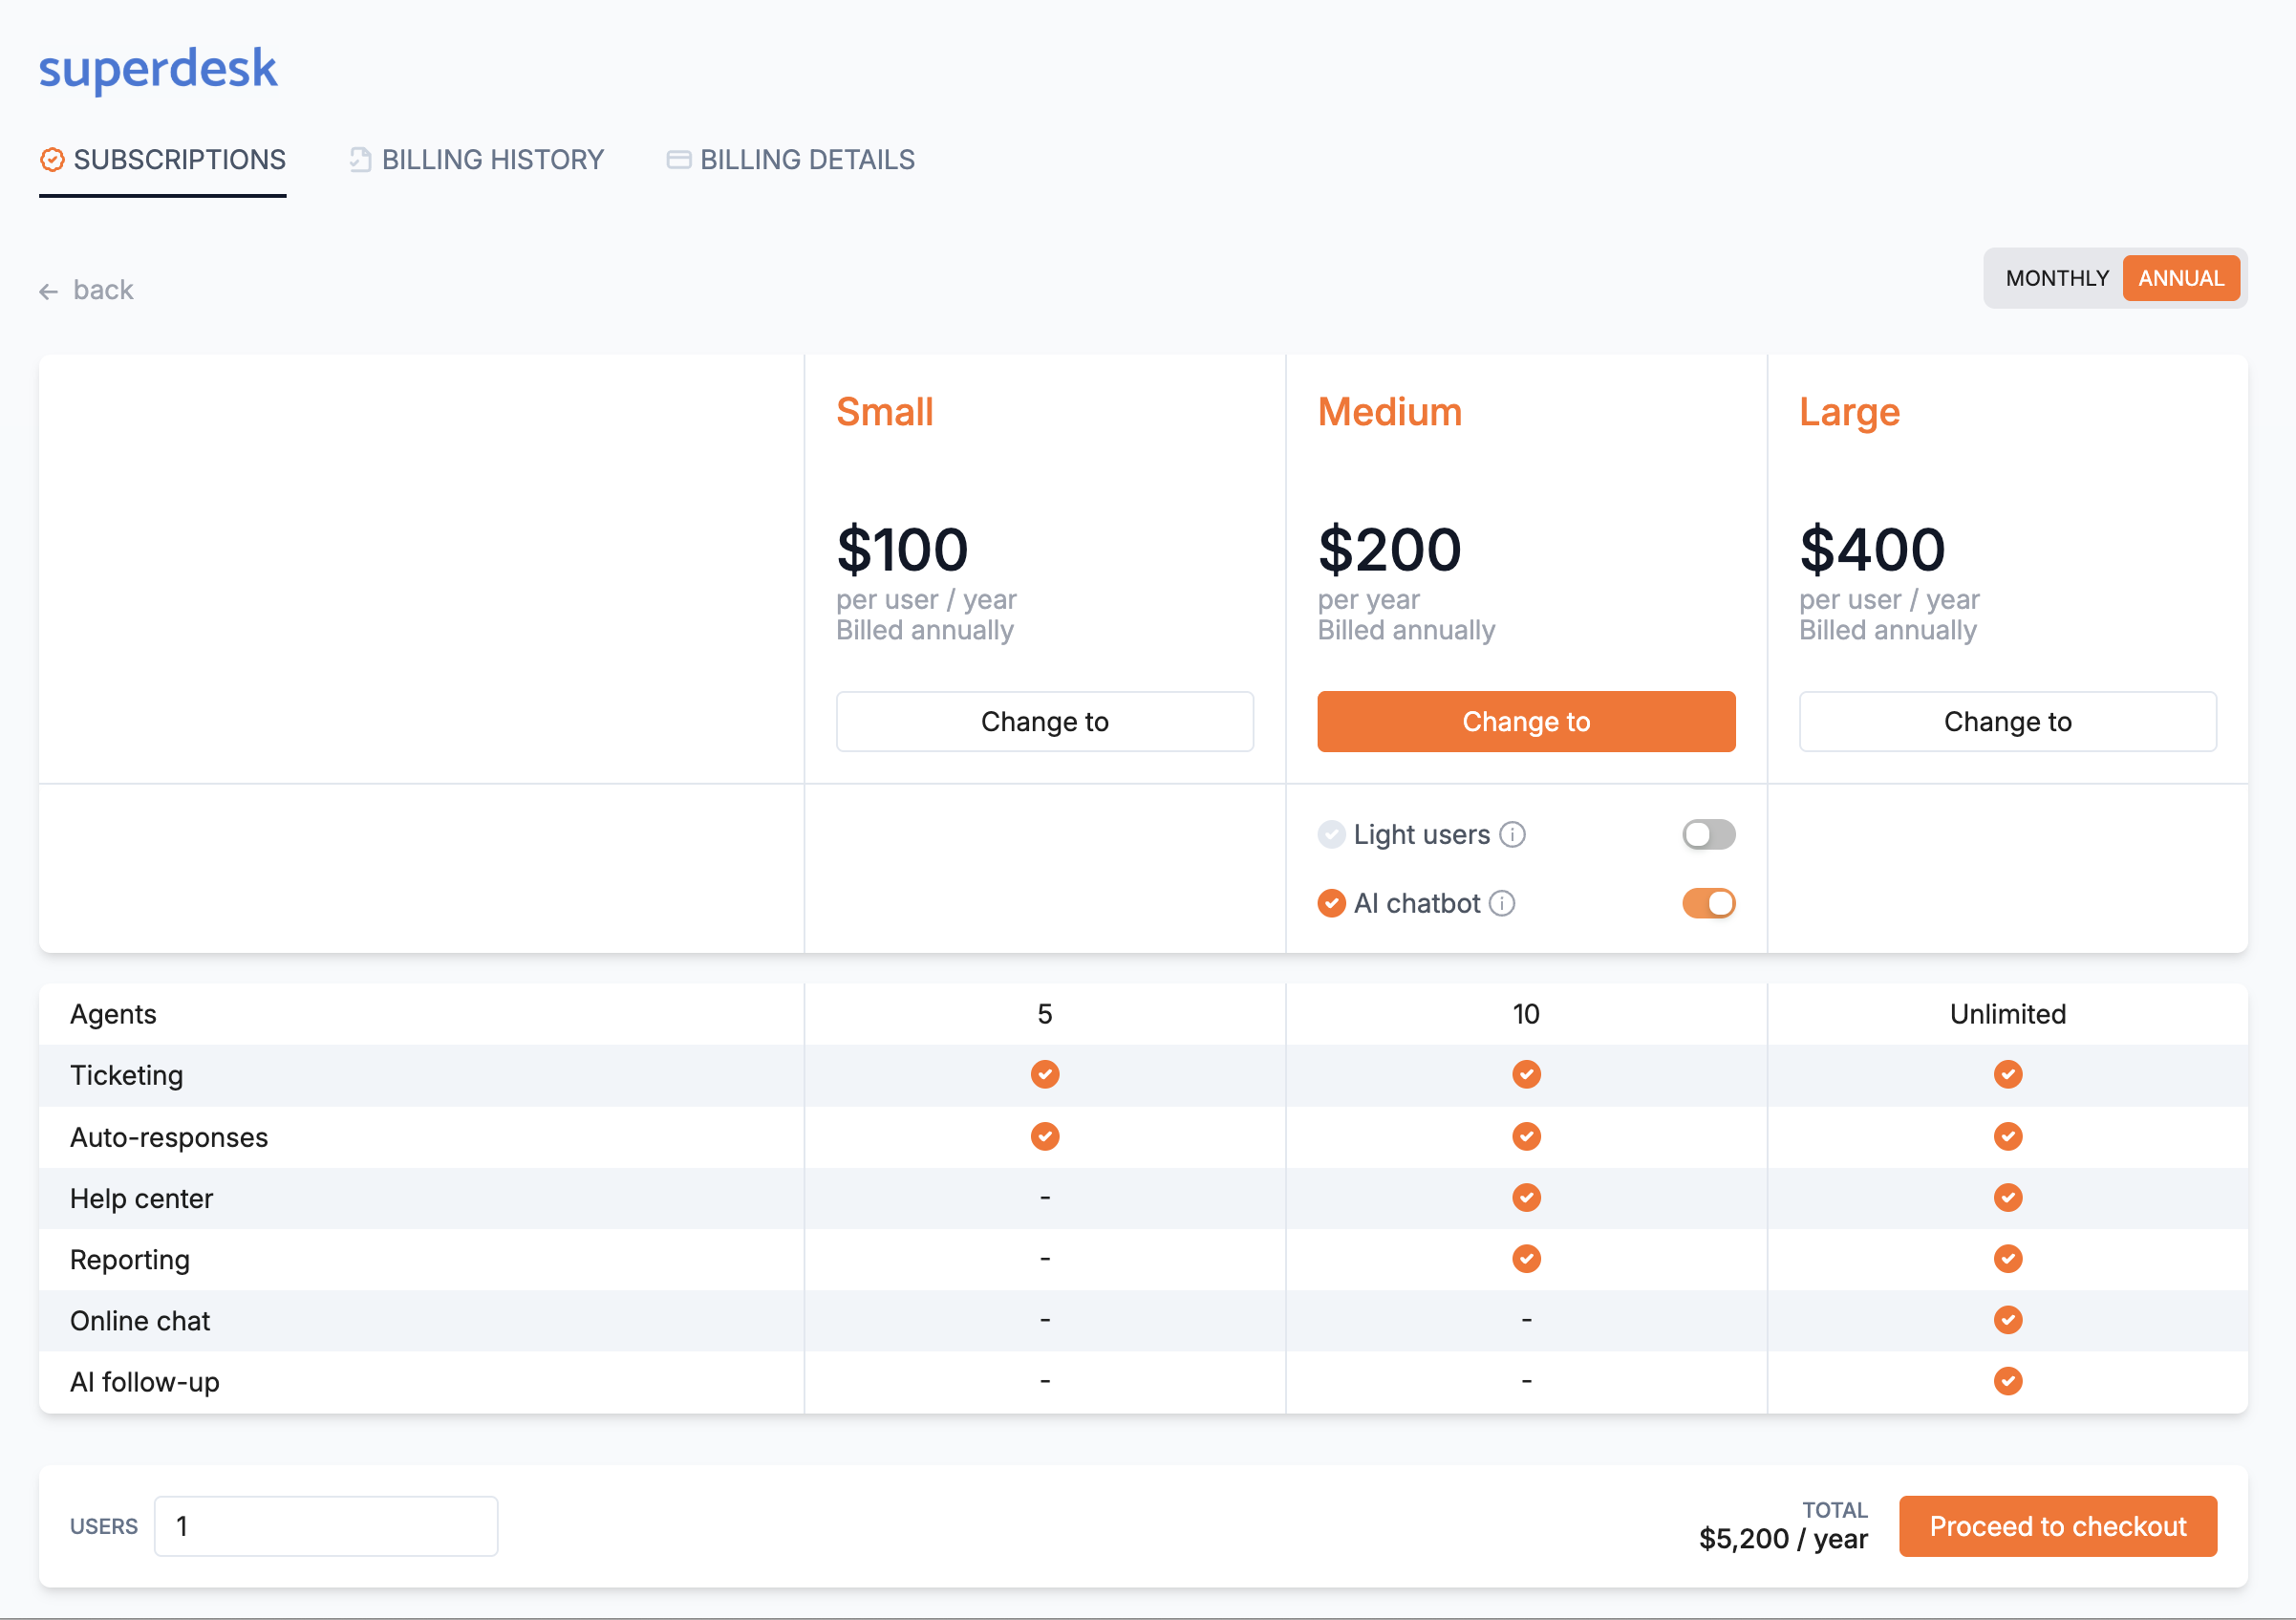
In the example above, the Medium plan has feature add-ons that can be toggled on. Here the AI chatbot is a $5,000 annual fee that will be billed on top of the $200 for the user that’s currently on the plan.
Usage-based plans
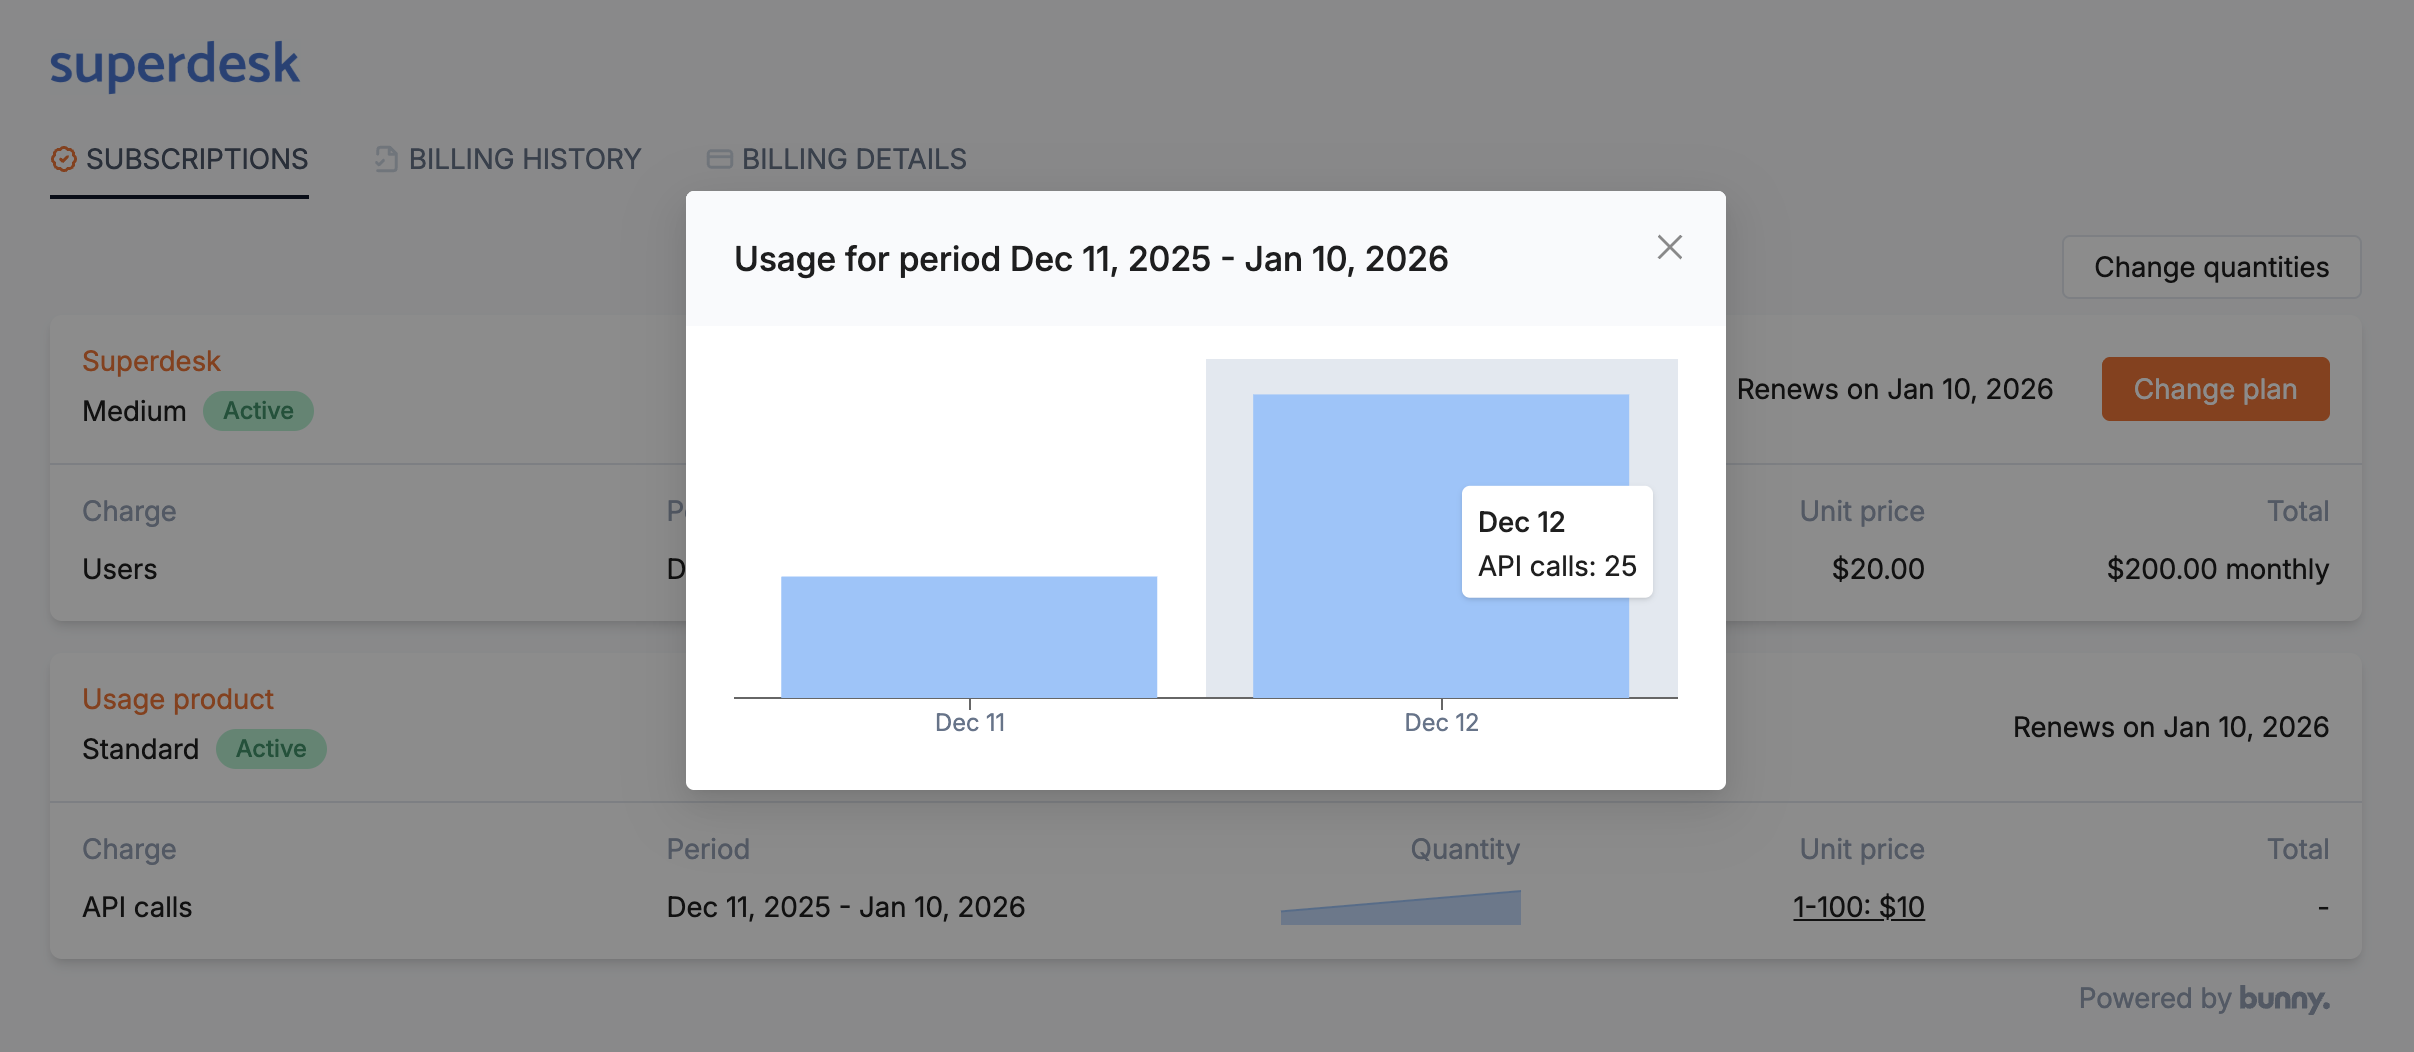
Subscriptions that have usage-based plans will show their current usage using a little sparkline. You can hover over the sparkline to see current usage and by clicking on it, you will see usage for the current and past few periods.