Revenue
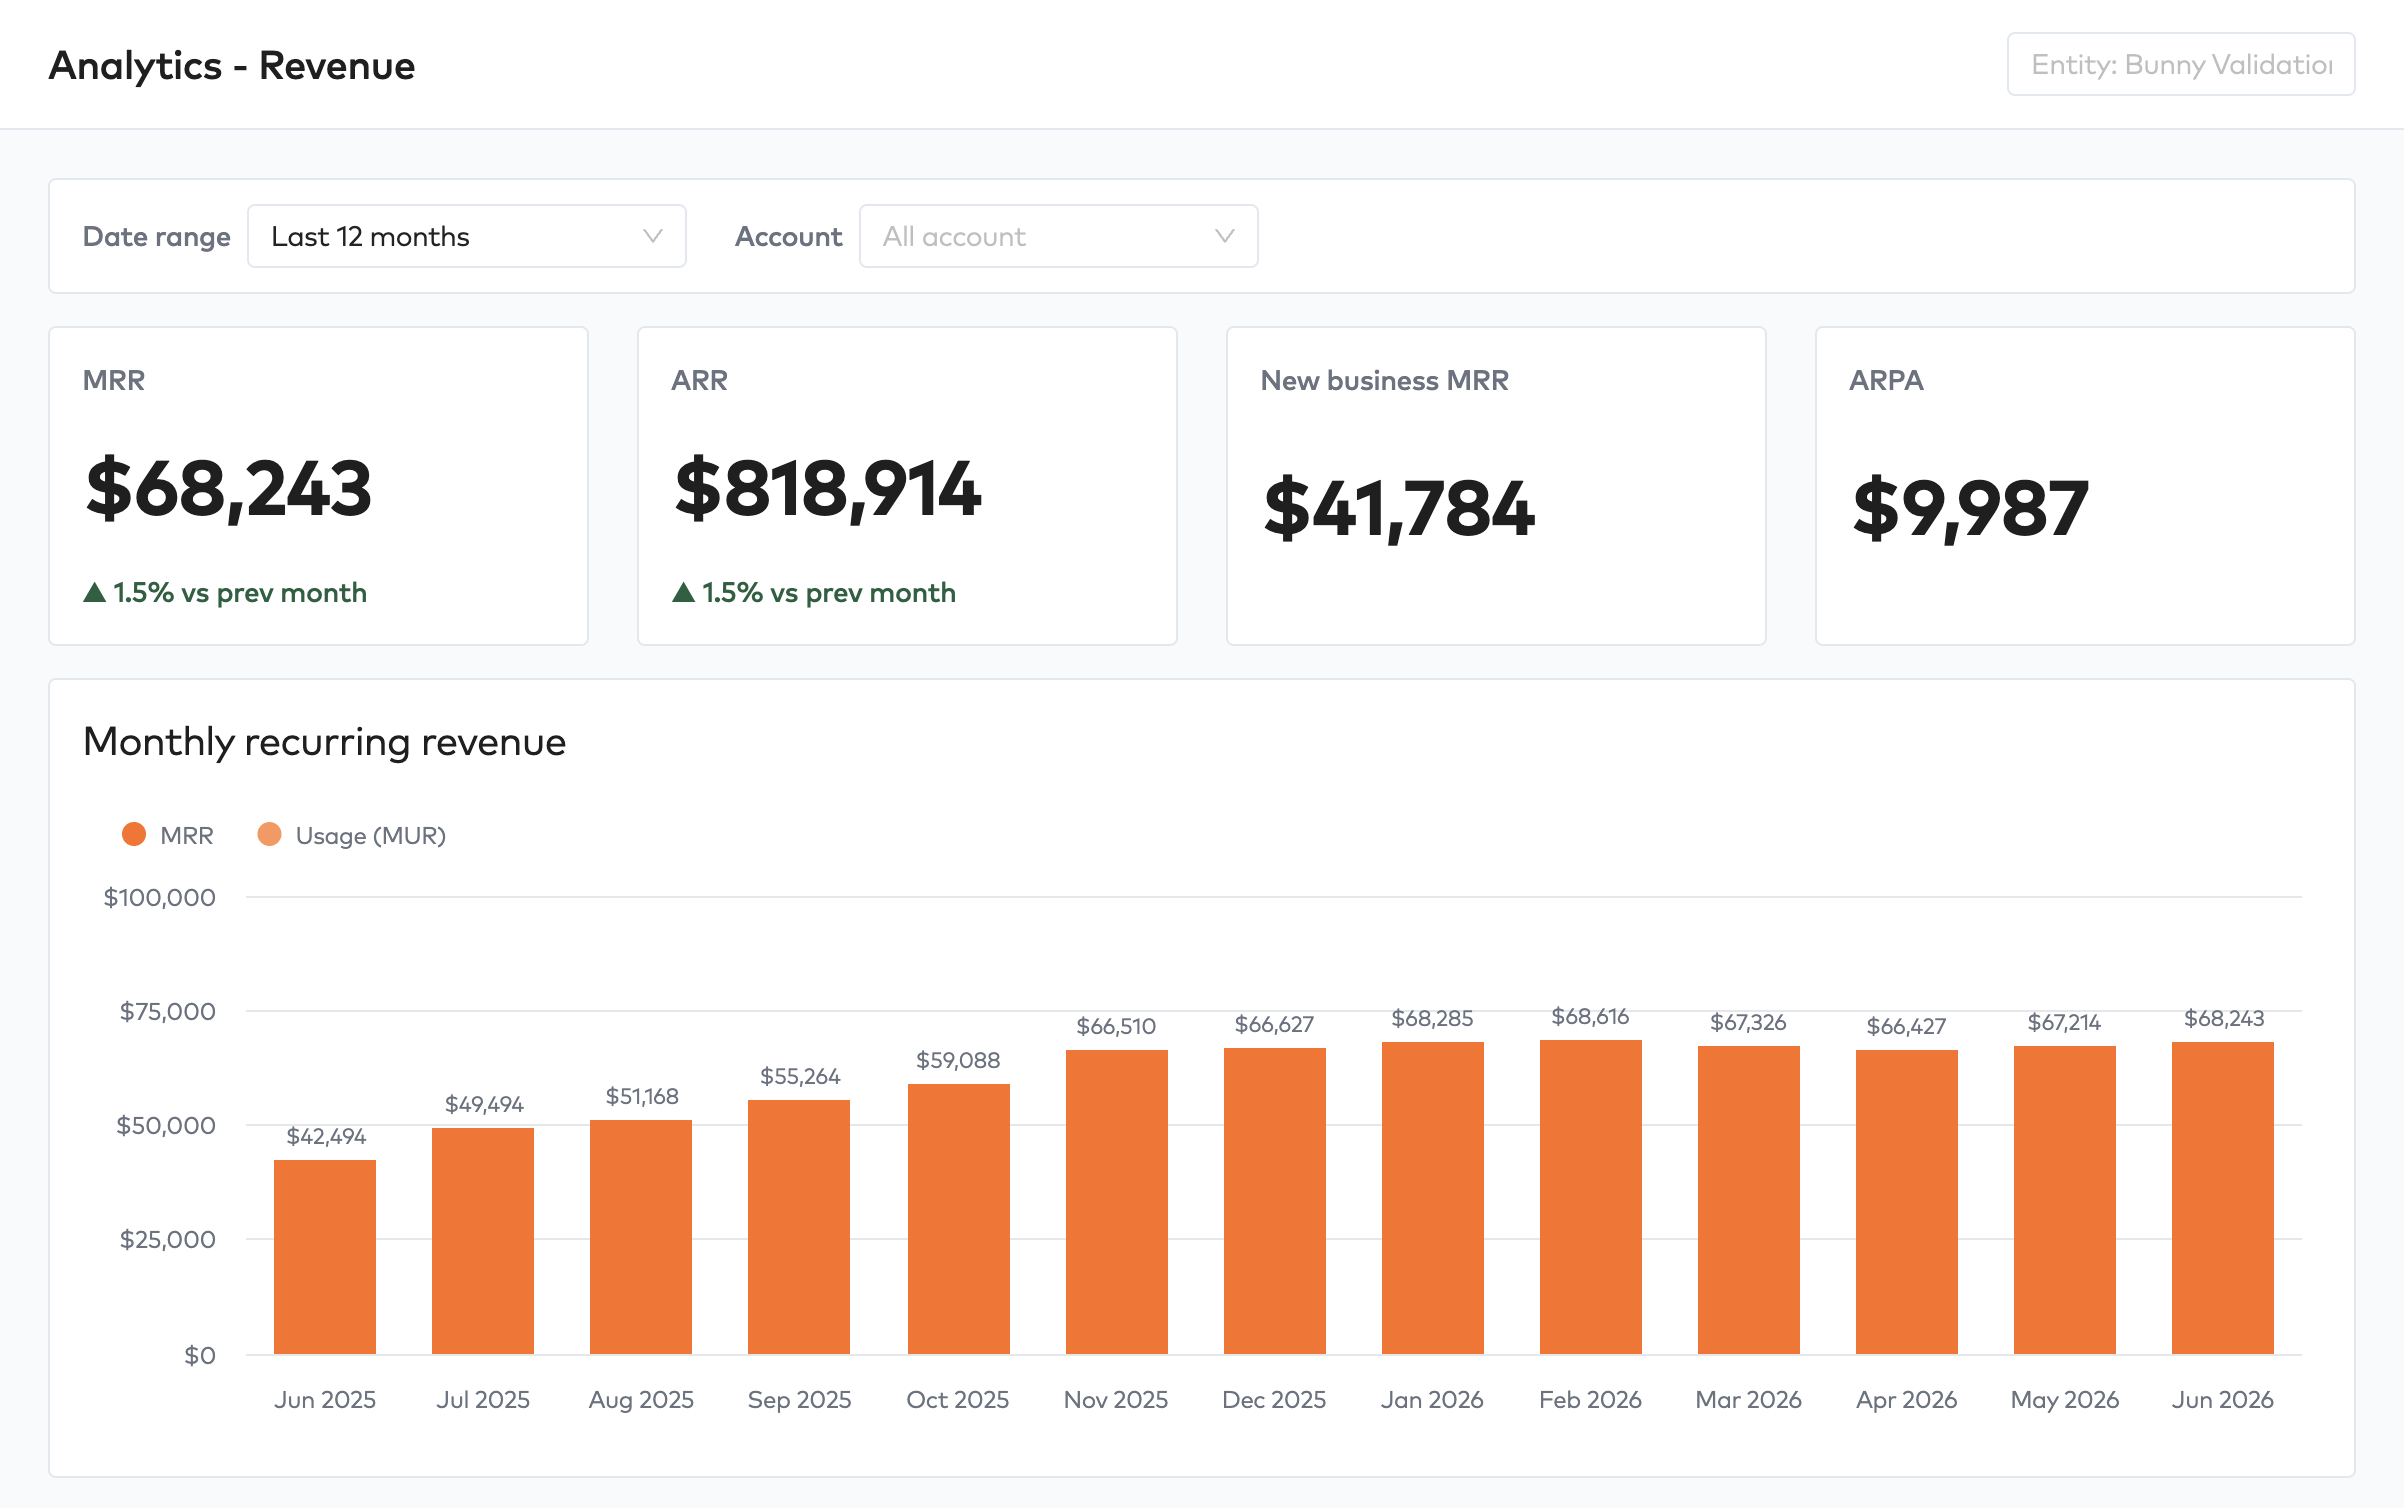
The Bunny revenue dashboard shows MRR, ARR and usage revenue, ARR movements such as expansion and churn, CMGR and revenue by geography.
The revenue dashboard is divided into three
Recurring and usage-based revenue
Revenue movements
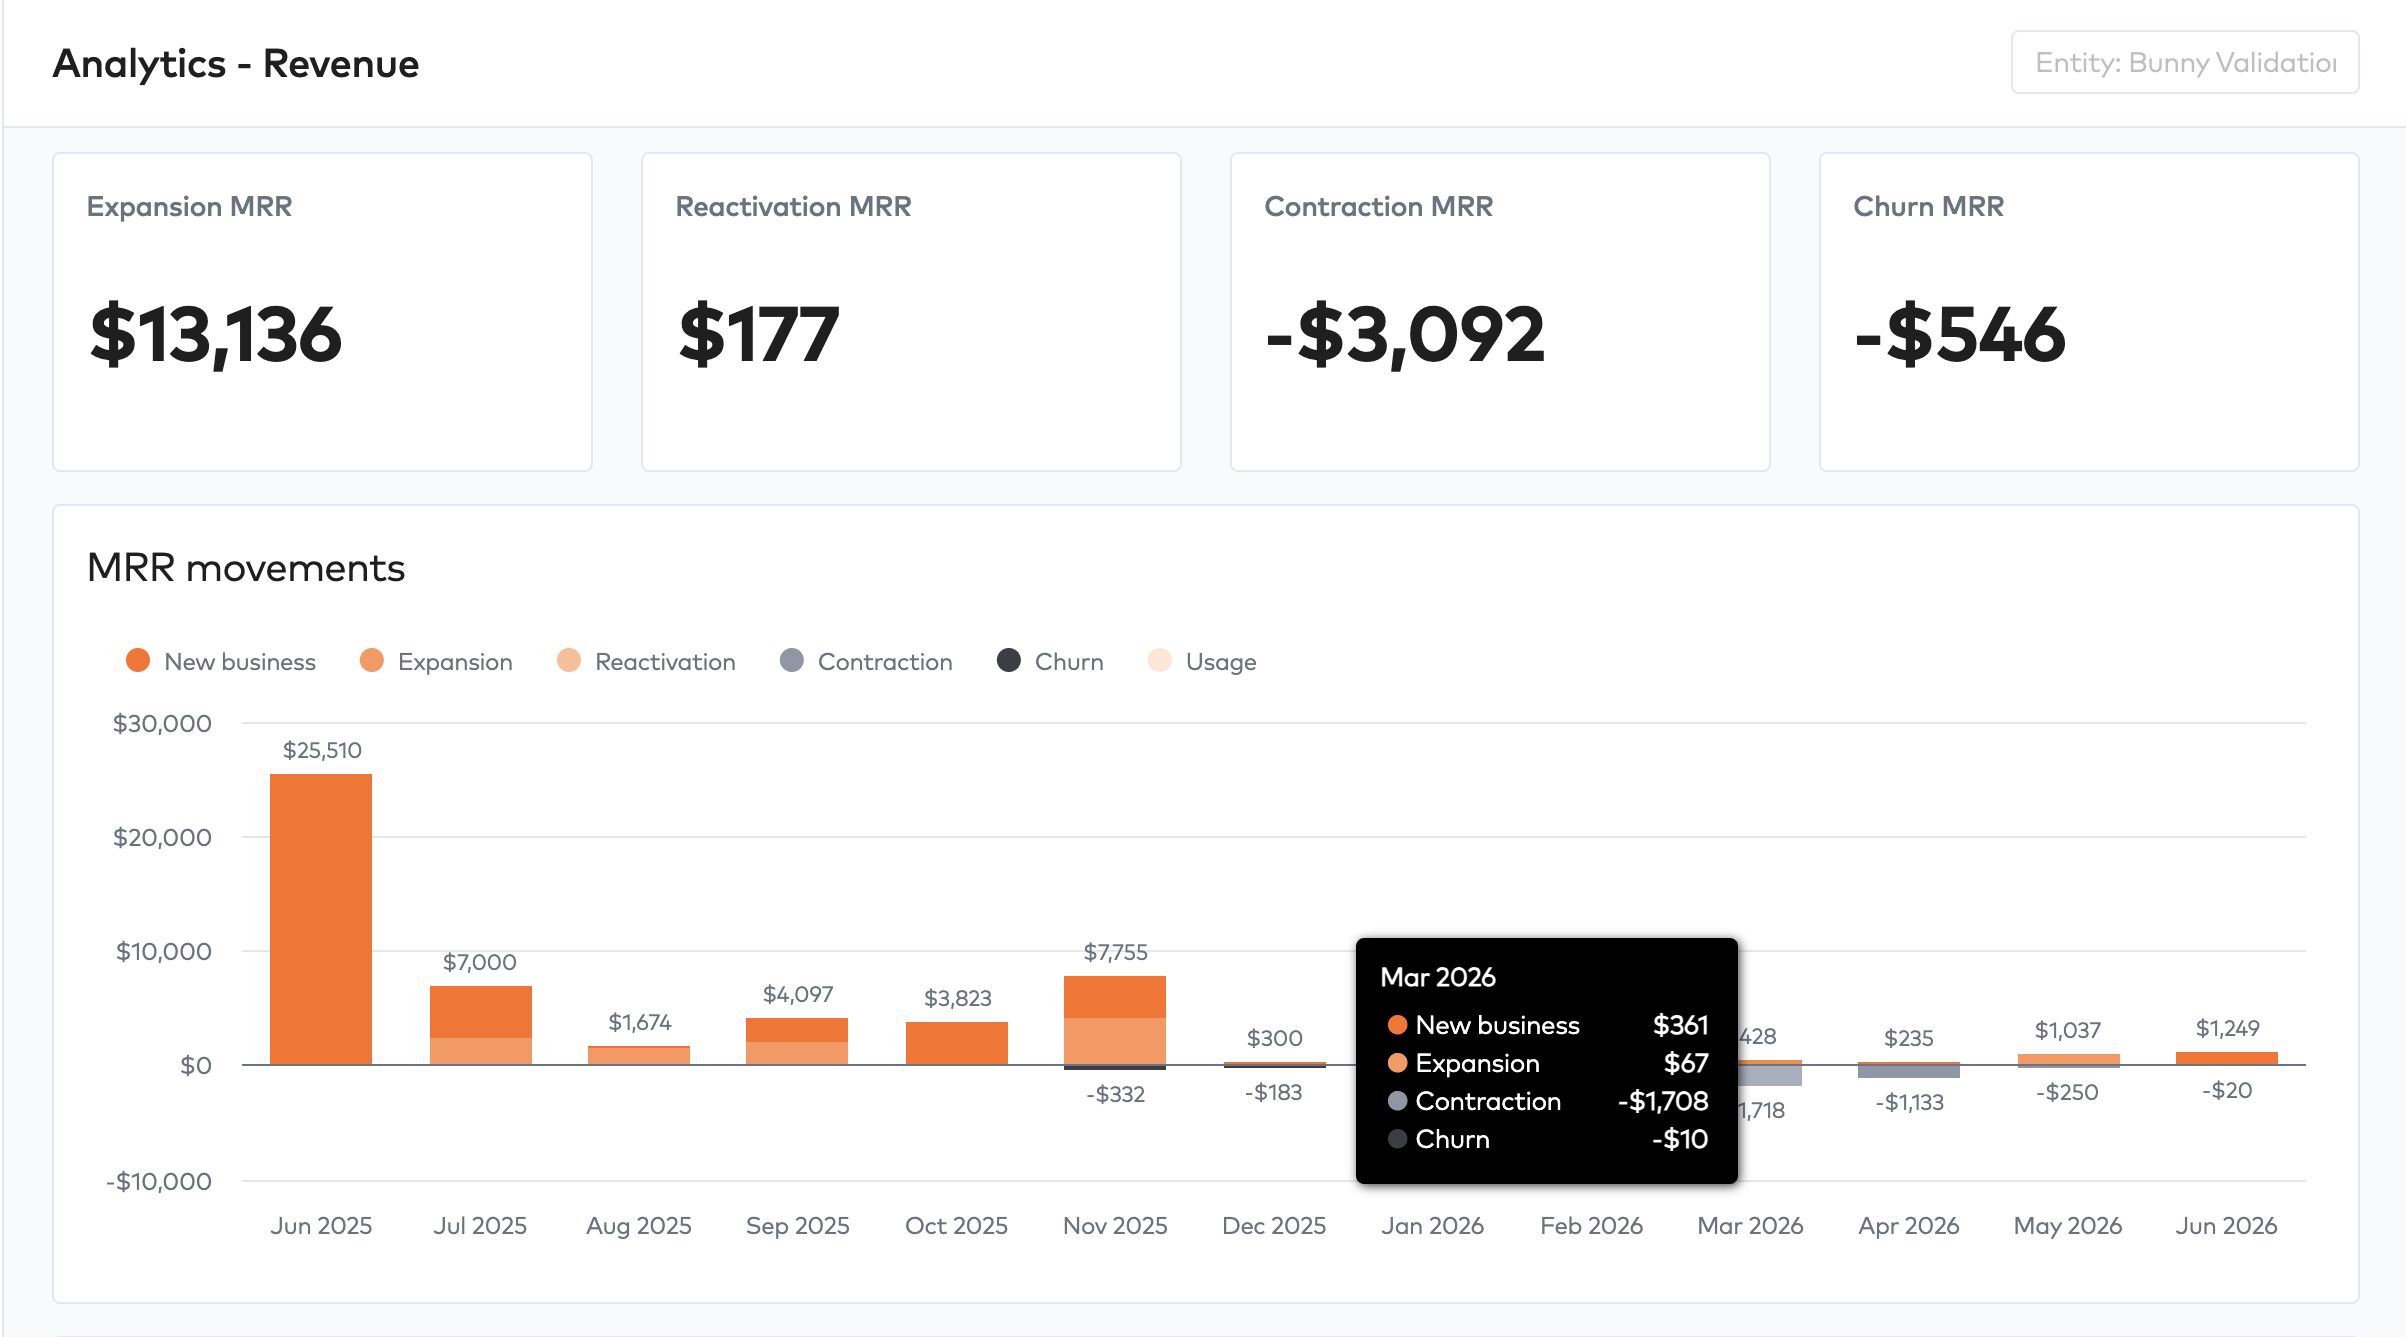
Revenue movements track how your ARR changes between periods. There are five core components:
- New business — ARR added from net-new customers signing their first contract.
- Expansion — ARR added from existing customers increasing spend: upgrading plans, adding seats, adding add-ons, or expanding usage.
- Contraction — ARR lost from existing customers reducing spend: downgrading, removing seats or add-ons, or capping usage.
- Churn — ARR lost from customers canceling entirely.
- Reactivation — ARR recovered from previously churned customers returning.
In addition, this chart also shows how usage-based revenue has increased or decreased compared to the previous period.
Compound Monthly Growth Rate (CMGR)
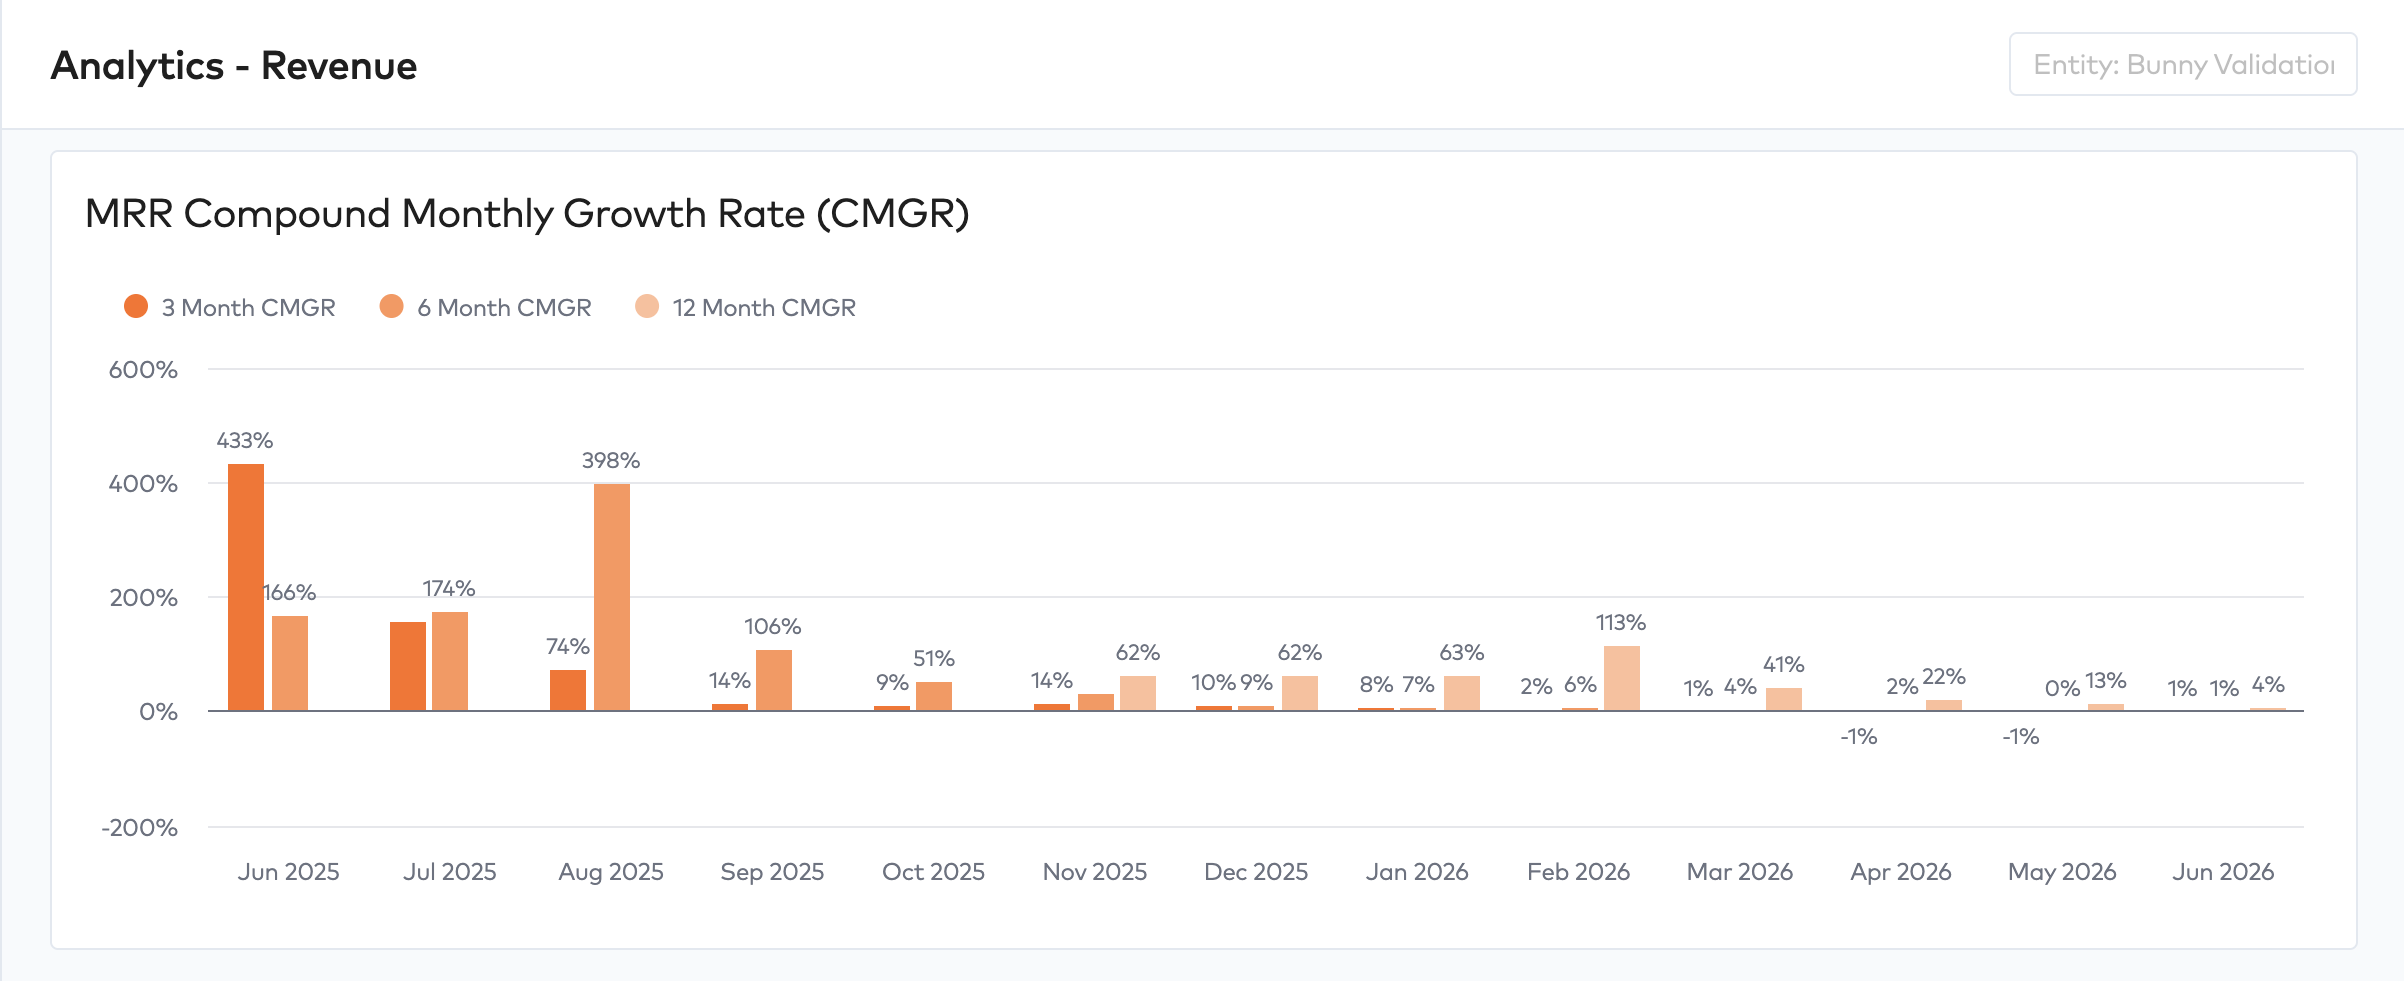
CMGR is a metrics that is heavily used in B2B SaaS and by investors to evaluate a company’s month-over-month traction over an extended period (typically 7 to 18 months).
Geography
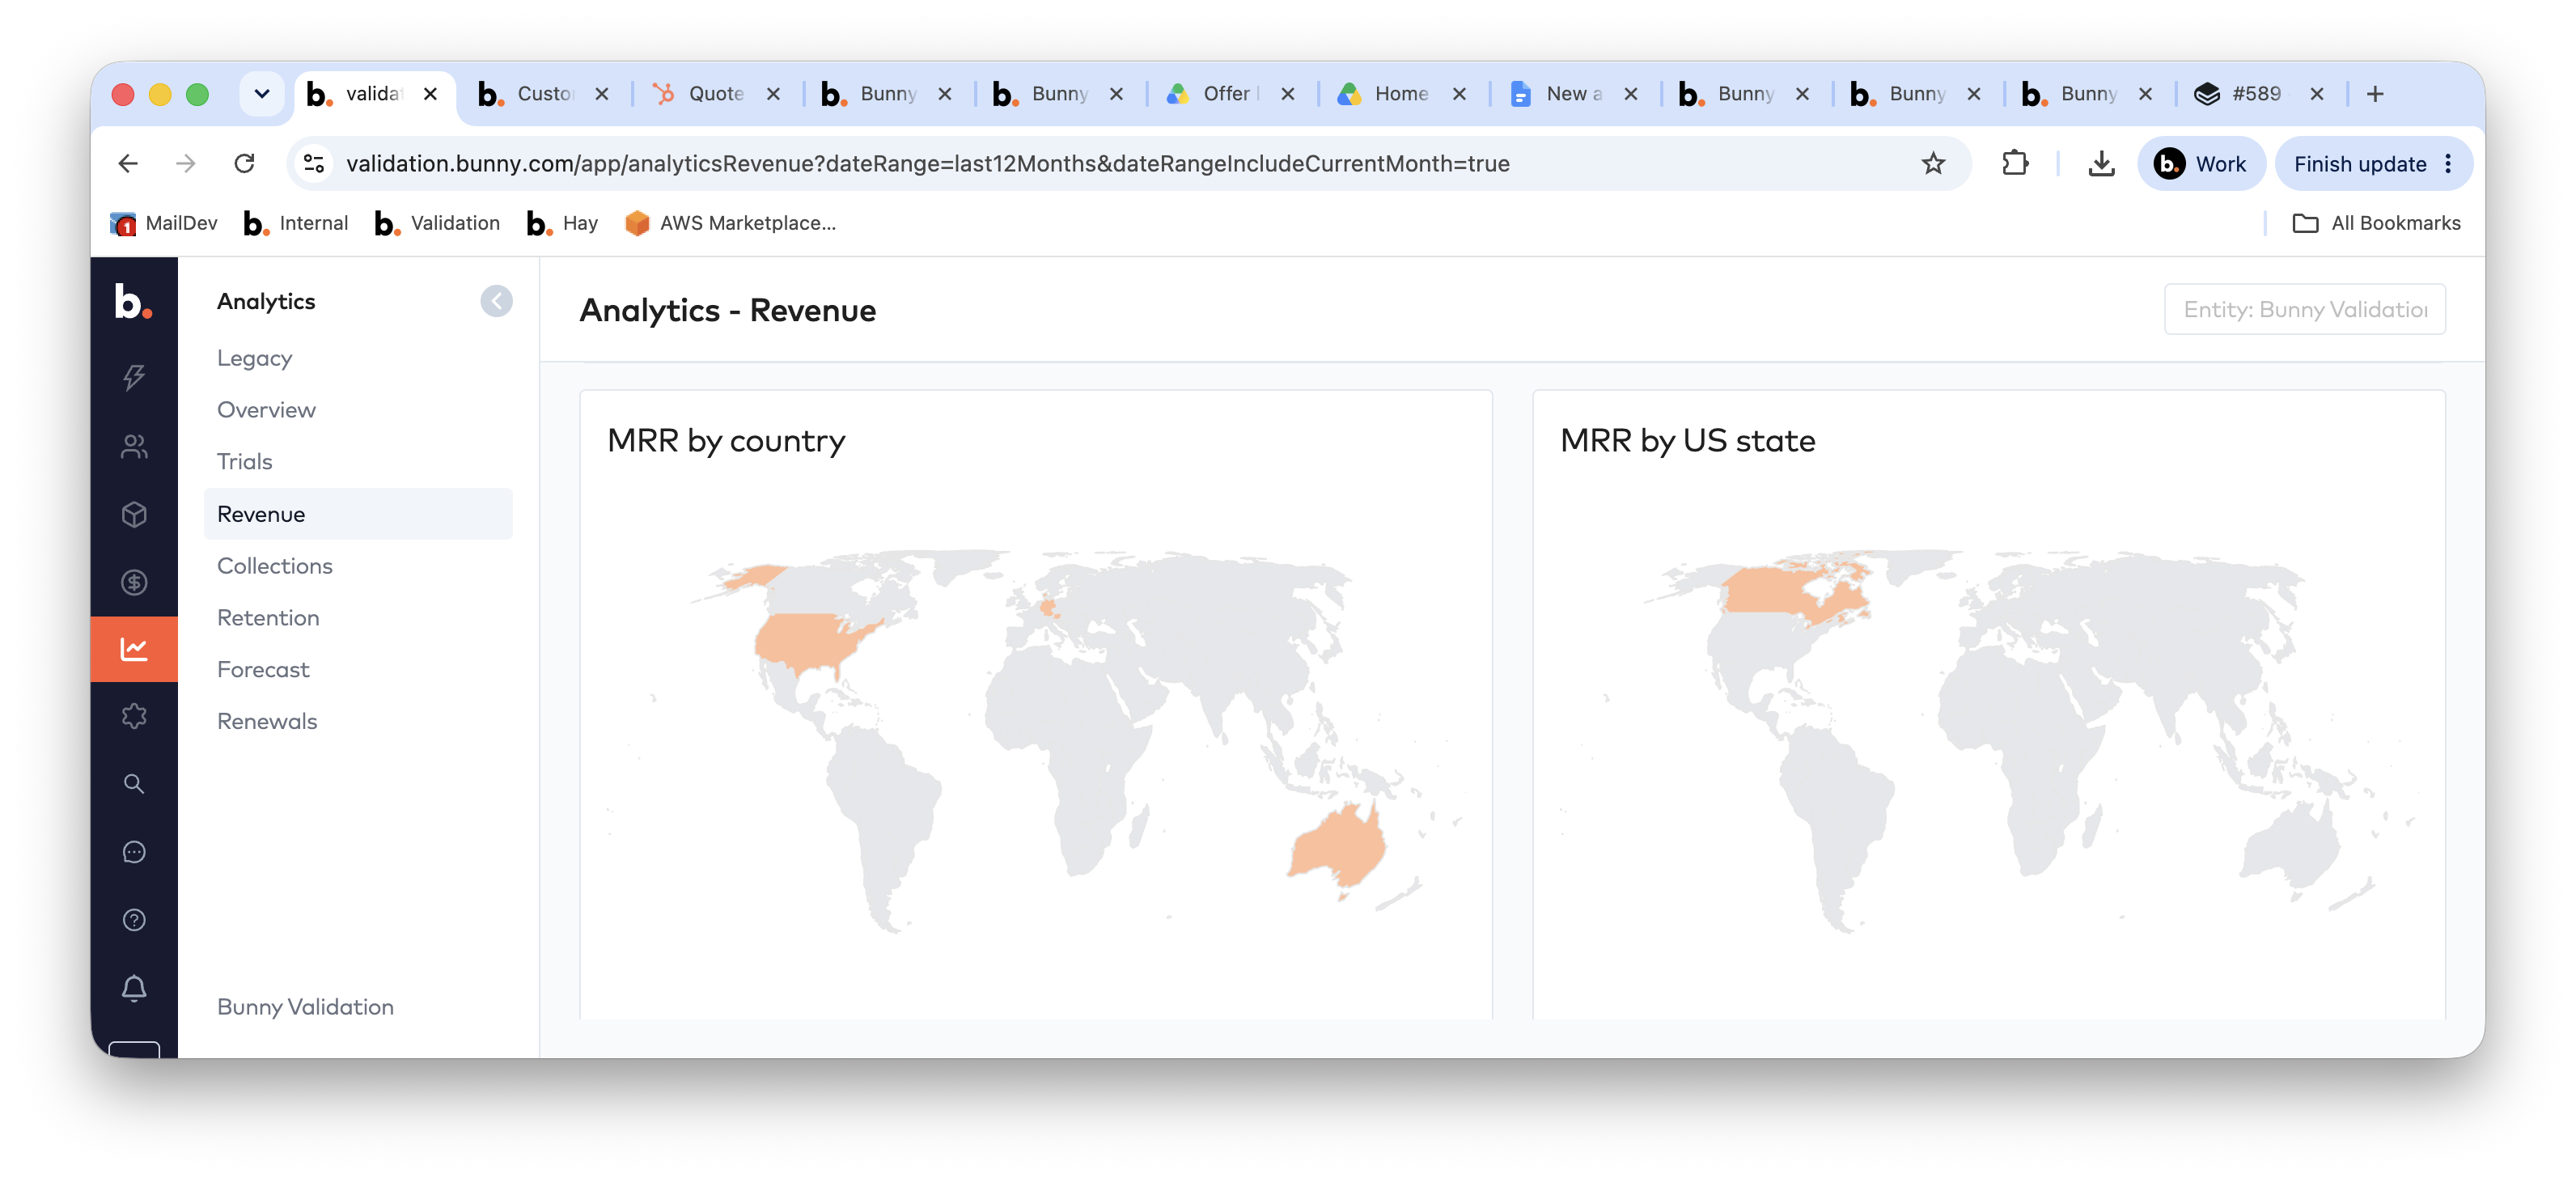
The last part of the revenue dashboard shows the revenue broken down by geography; internationally and by US states.